
Pricing your rental property is one of the most critical decisions you’ll make as a landlord. Price it too high, and it sits vacant for weeks—costing you thousands in lost rent. Price it too low, and you leave money on the table every single month.
The difference between optimal pricing and guessing can cost you $3,000$10,000+ per year.
After 19 years of managing 250 properties in the Lansing tri-county area, I’ve learned that pricing isn’t about picking a number that “feels right.” It’s a systematic process that balances market data, property condition, tenant demographics, and timing.
This blog walks you through the exact framework we use to price rental properties for maximum ROI—and how to adjust pricing as market conditions change.
Why Pricing Matters More Than You Think
Most landlords focus on the monthly rent number. But optimal pricing isn’t just about maximizing the dollar amount—it’s about maximizing total annual return while minimizing vacancy and turnover.
The Hidden Costs of Bad Pricing
Scenario 1: Priced Too High – Monthly rent: $1,500 (market rate is $1,400) Vacancy period: 60 days (vs. 15 days at market rate) – Lost rent during vacancy: $3,000 – Annual revenue: $15,000 ($1,500 × 10 months occupied) – Net loss vs. optimal pricing: $1,800
Scenario 2: Priced at Market – Monthly rent: $1,400 – Vacancy period: 15 days Lost rent during vacancy: $700 – Annual revenue: $16,100 ($1,400 × 11.5 months) Net gain vs. overpriced: $1,100
Scenario 3: Priced Too Low – Monthly rent: $1,300 (market rate is $1,400) – Vacancy period: 7 days (fills immediately) – Lost rent during vacancy: $300 – Annual revenue: $15,400 ($1,300 × 11.83 months) – Net loss vs. optimal pricing: $700/year
The lesson: Overpricing costs you more than underpricing in the short term, but underpricing costs you more over the life of the lease. Optimal pricing = fastest time to lease at the highest sustainable rent.
The Lansing, Michigan Market: What You Need to Know
Lansing isn’t Ann Arbor. It’s not Detroit. It’s not Grand Rapids. The rental market here has unique characteristics that affect pricing strategy.
Key Market Characteristics (2025)
- Tenant Demographics – Student renters: Michigan State University drives demand in East Lansing, Okemos, and Haslett – Young professionals: State government employees, healthcare workers, auto industry – Families: Stable, long-term renters in suburbs (DeWitt, Holt, Grand Ledge) – Section 8: Significant portion of market in Lansing proper
- Seasonal Demand – Peak leasing season: May–August (MSU students, families moving before school year) – Slow season: November–February (fewer move-ins, holidays, weather) – Shoulder season: March–April, September–October (moderate activity)
- Geographic Variations Rent varies significantly by location within the tri-county area: – East Lansing (near MSU): $800–$1,200/bedroom (high demand, studentdriven) – Okemos/Haslett: $1,200–$1,800 for 2–3 bedrooms (families, professionals, top schools) – Lansing (downtown/Old Town): $900–$1,400 for 2 bedrooms (young professionals, walkability) – Lansing (south/west sides): $700–$1,100 for 2–3 bedrooms (working-class families, Section 8) – DeWitt/Holt/Grand Ledge: $1,100$1,600 for 3 bedrooms (suburban families, schools)
- Property Type Matters – Single-family homes: Premium pricing (families, pets, yards) – Duplexes/townhomes: Mid-range (balance of space and affordability) Apartments (small buildings): Lower per-unit pricing (students, young professionals) Large apartment complexes: Competitive pricing (amenities, professional management)
- Condition Premium – Fully updated (new kitchen, bath, flooring, appliances): +15–25% vs. average – Well-maintained (clean, functional, no deferred maintenance): Market rate – Dated but functional (older finishes, no major issues): -10–15% vs. market – Needs work (deferred maintenance, cosmetic issues): -2030% vs. market The 7-Step Pricing Framework
Here’s the exact process we use to price every rental property for maximum ROI.
Step 1: Research Comparable Properties
What to look for: – Same neighborhood (within 1–2 miles) – Same property type (single-family, duplex, apartment) – Same bedroom/bathroom count – Similar square footage (±200 sq ft) – Similar condition and age – Currently available OR recently rented (within 30 days)
Where to research: – Zillow: Most comprehensive for Lansing area; filter by “for rent” Apartments.com: Good for multi-family comparisons – Facebook Marketplace: Increasingly popular for Lansing rentals – Craigslist: Still active in Lansing, especially for individual landlords – Trulia/Realtor.com: Secondary sources – Drive the neighborhood: Look for “For Rent” signs (not all landlords list online)
What to record: Create a spreadsheet with: – Address – Bedrooms/bathrooms – Square footage – Rent price – Days on market – Condition (based on photos) – Amenities (garage, yard, appliances, laundry, pets allowed)
Sample comparison (3-bedroom, 1.5-bath in Okemos):
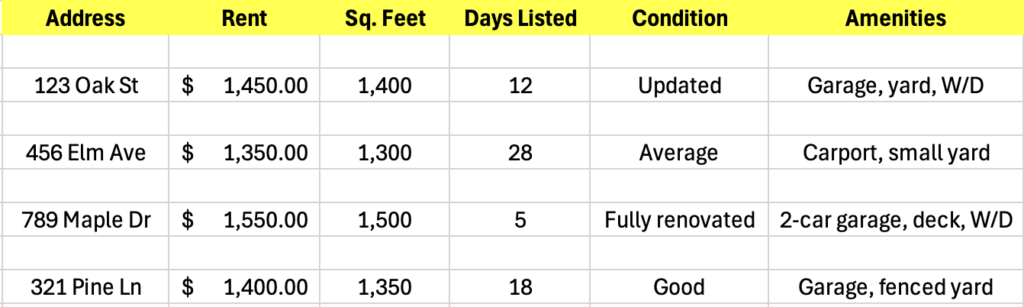
Your property: 1,375 sq ft, good condition, garage, fenced yard, W/D hookups Initial pricing range based on comps: $1,400–$1,450 Step 2: Adjust for Property-Specific Features
Not all 3-bedroom homes are created equal. Adjust your pricing based on features that tenants value.
Premium features (+5–15% each): – Updated kitchen: New cabinets, countertops, appliances (+10–15%) – Updated bathrooms: New vanity, fixtures, tile (+10%) – New flooring: Luxury vinyl plank, hardwood, new carpet (+5–10%) – Central air conditioning: Essential in Lansing summers (+10% if neighborhood average doesn’t have it) – In-unit washer/dryer: Huge convenience factor (+$50–$100/month) – Garage (2-car vs. 1-car): Extra storage, winter appeal (+$50–$75/month) – Fenced yard: Families with kids/pets (+$25–$50/month) – Finished basement: Extra living space (+ $75–$150/month depending on size/quality) – Pet-friendly: Expands tenant pool, justifies pet fees – Energy efficiency: New windows, insulation, high-efficiency furnace (marketing advantage)
Negative features (-5–20% each): – No central air: Major drawback in summer (-1015%) – No laundry hookups: Tenants must use laundromat (-$50–$75/month) – Street parking only: No garage or driveway (-$25–$50/month) – Busy road/highway noise: Safety and quality of life concern (-10%) – Deferred maintenance visible in photos: Peeling paint, worn carpet, dated fixtures (-15–20%) – Small/no yard: Limits tenant pool (families, pet owners) (-$25–$50/month) – Basement/first-floor unit: Less desirable than upper floors in apartments (-5–10%)
Example adjustment: – Base rent (from comps): $1,425 – Your property has: Updated kitchen (+$100), in-unit W/D (+$75), finished basement (+$100) – Your property lacks: Nothing significant – Adjusted rent: $1,425 + $275 = $1,700
But wait—this is where Step 3 comes in.
Step 3: Reality-Check Against Market Absorption Rate
Just because your property could rent for $1,700 doesn’t mean it should.
Market absorption rate = how quickly properties at different price points are renting.
How to calculate: Look at your comps again. How long have properties been sitting at different price points? Example (3-bedroom homes in your neighborhood): – $1,300–$1,400: Renting in 714 days – $1,400–$1,500: Renting in 14–21 days – $1,500–$1,600: Renting in 21–35 days – $1,600+: Sitting 35+ days or not renting
Your decision: If your adjusted price is $1,700, but properties above $1,600 are sitting for 35+ days, you have two options:
Option A: Price at $1,700 and wait – Risk: 35–60 days vacant = $2,000–$3,500 lost rent – Reward: $200–$300/month premium if it rents = $2,400–$3,600/year – Breakeven: You need the tenant to stay 12+ months to recover the vacancy cost
Option B: Price at $1,550 and rent quickly – Risk: Leaving $150/month on the table = $1,800/year – Reward: Rents in 14–21 days, minimal vacancy cost – Break-even: Immediate positive cash flow
Our recommendation: Price at the high end of the fast-absorption range ($1,500$1,550) unless you can afford to wait and your property truly justifies the premium.
Rule of thumb: Every extra week of vacancy costs you more than $25–$50/month in rent premium over a 12-month lease.
Step 4: Factor in Seasonality
Lansing’s rental market has distinct seasonal patterns. Timing affects both optimal pricing and speed to lease.
Peak Season (May–August): – Demand: High (MSU students, families moving before school) – Competition: High (most landlords list in spring/summer) – Pricing strategy: Price at market or slightly above; properties move quickly – Time to lease: 7–21 days at market rate
Shoulder Season (March–April, September–October): – Demand: Moderate (some student turnover, job relocations) – Competition: Moderate – Pricing strategy: Price at market; avoid overpricing – Time to lease: 14–30 days at market rate
Slow Season (November–February): – Demand: Low (holidays, weather, fewer relocations) – Competition: Low (fewer listings) – Pricing strategy: Price 5–10% below peak-season rate OR offer incentives (first month free, waived fees) – Time to lease: 30–60+ days even at reduced rates Example: – Your property’s optimal rent (peak season): $1,500/month – Listing in July: Price at $1,500; expect to rent in 14–21 days – Listing in December: Price at $1,400 OR price at $1,500 with “First Month Free” incentive
First Month Free math: – Effective annual rent: $1,500 × 11 months = $16,500 Effective monthly rent: $16,500 ÷ 12 = $1,375/month – Advantage: Tenant sees “$1,500/month” (higher perceived value), you get faster lease, tenant pays $1,500/ month after Year 1
Our approach: We rarely list new properties in November–January unless absolutely necessary. If a tenant gives notice in fall, we offer lease extensions or early renewals to avoid winter vacancy.
Step 5: Understand Your Target Tenant
Different tenant demographics have different price sensitivities and priorities.
MSU Students: – Price sensitivity: High (limited budgets, parents paying) – Priorities: Location (walkable to campus), roommate-friendly layouts, parking – Pricing strategy: Competitive pricing, price per bedroom, lease timing (August start) – Rent range: $400$600/bedroom (total $1,200–$2,400 for 3–4 bedroom)
Young Professionals: – Price sensitivity: Moderate (stable income, value quality) Priorities: Updated finishes, in-unit laundry, parking, pet-friendly – Pricing strategy: Mid-to-high range, emphasize quality and convenience – Rent range: $900–$1,400 for 1–2 bedrooms
Families: – Price sensitivity: Moderate to low (dual income, long-term mindset) Priorities: School districts, yard, safe neighborhood, space, garage – Pricing strategy: Premium pricing justified by family-friendly features – Rent range: $1,200–$1,800 for 34 bedrooms in good school districts
Section 8/Voucher Holders: – Price sensitivity: High (voucher limits) – Priorities: Passing inspection, landlord willing to accept vouchers, location near services – Pricing strategy: Must stay within HUD Fair Market Rent limits for Ingham County – Rent range: Check HUD FMR limits (updated annually)
Example: Your 3-bedroom home is in Okemos near good schools, has a fenced yard, and updated kitchen.
Target tenant: Families Pricing strategy: Premium pricing ($1,500–$1,600) emphasizing school district, yard, and move-in ready condition Marketing message: “Beautiful 3-bedroom family home in top-rated Okemos schools. Fenced yard, updated kitchen, 2-car garage. Perfect for families. $1,550/month.”
Step 6: Test the Market and Adjust Quickly
Pricing isn’t set-it-and-forget-it. The market will tell you if you’re priced correctly—usually within 7–14 days.
Indicators you’re priced correctly: – 5–10 inquiries in first 3 days – 2–3 showings scheduled in first week – Application submitted within 14 days – Lease signed within 21 days
Indicators you’re priced too high: – Fewer than 3 inquiries in first week – Inquiries but no showing requests (“Just checking prices”) – Showings but no applications (they’re comparing and choosing cheaper options) – Still available after 21 days
Indicators you’re priced too low: – 20+ inquiries in first 24 hours – Multiple applications within 3 days – Tenants offering to pay more or sign immediately
Adjustment strategy:
Week 1–2: Hold your price. Give the market time to respond.
Week 3: If no applications, reduce by 3–5% ($1,500 → $1,450).
Week 4: If still no applications, reduce another 3–5% ($1,450 → $1,400) OR add incentives (first month free, waived pet deposit).
Week 5+: If still no applications, reassess: – Is the property condition worse than photos suggest? (Schedule better photos or minor updates) – Is the location less desirable than you thought? (Reduce to neighborhood average) – Is the market slower than expected? (Seasonal issue—consider incentives)
Real-world example: We listed a 2-bedroom duplex in Lansing at $1,100 (based on comps). After 10 days, we had only 2 inquiries and no showings.
We reduced to $1,050. Within 3 days, we had 5 showings and 2 applications. We rented to a qualified tenant at $1,050.
Cost of waiting: If we’d held at $1,100 for 30 days, we’d have lost $1,100 in vacancy. By adjusting quickly, we lost $50/month × 12 months = $600/year, but avoided $1,100 in immediate vacancy cost. Net benefit: $500 by adjusting quickly.
Step 7: Build in Annual Rent Increases
Optimal pricing isn’t just about the initial lease—it’s about maximizing revenue over the tenant’s lifetime.
Annual rent increase strategy:
Year 1 (initial lease): Price at market rate (using Steps 1–6) Year 2 (first renewal): Increase by 3–5% OR adjust to current market rate, whichever is higher – Example: $1,500 → $1,545 (3%) or $1,575 (5%) – Market check: If market rate is now $1,600, increase to $1,575–$1,600
Year 3+: Continue 3–5% annual increases OR market adjustments Why this works: – Tenants expect increases: Most accept 3–5% as reasonable Keeps pace with inflation: Your costs (taxes, insurance, maintenance) increase annually – Avoids under-market pricing: Prevents leaving money on the table over time – Rewards long-term tenants: Smaller annual increases vs. market-rate reset if they leave
Communication strategy: Give tenants 90 days’ notice of rent increase (required by most leases and local laws). Frame it positively:
“Hi [Tenant Name],
Your lease is up for renewal on [date]. We’ve loved having you as a tenant—you’ve taken great care of the property and been a pleasure to work with.
For the upcoming year, rent will increase to $[new amount] (a [X]% increase). This adjustment reflects rising property costs and keeps the rent in line with current market rates in the area.
We’d love to have you stay. Please let me know by [date] if you’d like to renew.
Thanks, [Your Name]”
Retention rate: At Simply Live, 80%+ of tenants renew despite annual increases because: 1. Moving costs more than the increase (moving truck, deposits, time off work) 2. They like the property and don’t want to move 3. The increase is reasonable and expected 4. We maintain the property well and provide great service Advanced Pricing Strategies
Once you’ve mastered the basics, here are advanced tactics to maximize ROI.
Strategy 1: Tiered Pricing for Lease Length
Offer different rates for different lease terms.
Example: – 6-month lease: $1,600/month (premium for flexibility) – 12-month lease: $1,500/month (standard) – 18-month lease: $1,475/month (discount for stability)
Why this works: – Longer leases reduce turnover costs – You’re willing to discount slightly for guaranteed occupancy – Tenants who want flexibility pay a premium
When to use: Properties in high-turnover areas (student housing) or when you want to lock in occupancy through slow season.
Strategy 2: Incentives vs. Price Reductions
Instead of lowering rent, offer incentives that don’t reduce the monthly rate.
Incentive options: – First month free: Effective rent reduction without lowering stated rate – Waived application/admin fees: $50–$100 savings – Waived pet deposit: $200–$400 savings (but still charge monthly pet rent) – Free parking (if normally charged separately) – Gift card for local business: $100–$200 value
Why this works: – Tenant sees higher “sticker price” (perceived value) – After Year 1, they pay full rent (no discount to overcome) – You avoid resetting market expectations downward
Example: Instead of reducing rent from $1,500 to $1,400: – Keep rent at $1,500 – Offer “First Month Free” ($1,500 value) – Effective Year 1 rent: $1,500 × 11 = $16,500 ($1,375/ month equivalent) – Year 2 rent: $1,500/month (no discount)
Advantage: Tenant is already paying $1,500/month mentally; easier to renew at that rate.
Strategy 3: Pet Rent vs. Pet Deposit
Maximize revenue from pet-owning tenants.
Traditional approach: – Pet deposit: $300 (one-time, refundable) – Annual revenue: $300 (Year 1 only) Our approach: – Pet deposit: $200 (one-time, refundable) – Pet rent: $35/month per pet (non-refundable) – Annual revenue: $200 + ($35 × 12) = $620 (Year 1), $420/year ongoing Over 3 years: – Traditional: $300 – Our approach: $620 + $420 + $420 = $1,460 Advantage: $1,160 more revenue over 3 years, plus pet rent increases with annual rent increases.
Strategy 4: Rent-to-Value Ratio Optimization
Don’t just price based on comps—price based on property value and target ROI. Formula: Target monthly rent = (Property value × Target annual ROI) ÷ 12 Example: – Property value: $180,000 – Target ROI: 8% annually – Target annual rent: $180,000 × 0.08 = $14,400 – Target monthly rent: $14,400 ÷ 12 = $1,200 Reality check: If market comps show $1,500/month is achievable, you’re exceeding your target ROI (10% instead of 8%).
If market comps show only $1,000/month is achievable, you’re below target ROI (6.7%) —consider selling or improving the property to justify higher rent.
Our target: 8–10% annual ROI after expenses (property management, maintenance, taxes, insurance).
Common Pricing Mistakes (And How to Avoid Them)
Mistake #1: Pricing Based on Your Mortgage
The error: “My mortgage is $1,200/month, so I need to charge at least $1,500 to cover costs and make a profit.” Why it’s wrong: The market doesn’t care about your costs. Tenants pay based on value, not your expenses.
The fix: Price based on market comps and property features. If market rent doesn’t cover your costs, you have a property problem, not a pricing problem.
Mistake #2: Emotional Pricing
The error: “I put $20,000 into renovations, so I deserve $1,800/month” (when market rate is $1,500).
Why it’s wrong: Tenants pay for current value, not your investment. Over-improving for the market is a capital allocation error.
The fix: Research market rents BEFORE renovating. Only invest in improvements that increase rent enough to justify the cost.
Mistake #3: Ignoring Days on Market
The error: “I’m going to hold out for $1,600 because that’s what I want.”
Why it’s wrong: Every week of vacancy costs you $350–$400. Holding out for an extra $100/month costs you $1,400–$1,600 in lost rent over 4 weeks.
The fix: Set a decision point: “If I don’t have an application by Day 21, I’m reducing to $1,500.”
Mistake #4: Not Adjusting for Seasonality
The error: Listing at peak-season pricing in December.
Why it’s wrong: Demand is 50–70% lower in winter. You’ll sit vacant for 60+ days. The fix: Reduce pricing by 5–10% OR offer incentives in slow season. Better to rent at $1,400 in December than sit vacant until March waiting for $1,500. Mistake #5: Underpricing to “Fill It Fast”
The error: “I’ll just charge $1,200 so it rents immediately” (when market rate is $1,400). Why it’s wrong: You’re leaving $2,400/year on the table. Over 5 years, that’s $12,000 in lost revenue.
The fix: Price at market rate and give it 14–21 days. Only reduce if the market tells you to.
The Simply Live Pricing Process
Here’s exactly what we do for every property we manage:
Step 1: Comprehensive market analysis (20–30 comps within 2 miles) Step 2: Property condition assessment (photos, inspection, feature list) Step 3: Pricing recommendation with 3 scenarios: – Conservative: Fast lease, lower end of market ($1,400) – Market: Balanced approach, mid-market ($1,500) Aggressive: Premium pricing, longer lease time ($1,600) Step 4: Owner consultation and final decision Step 5: Professional listing with high-quality photos and detailed description Step 6: Market monitoring (daily inquiry/showing tracking) Step 7: Adjustment recommendation if no applications by Day 21 Step 8: Annual rent increase analysis and recommendation (90 days before renewal) Results: – Average time to lease: 15–21 days – <2% vacancy rate across our portfolio – 80%+ tenant retention (tenants stay despite annual increases) – Average rent increase at renewal: 3–5% annually
Lansing-Specific Pricing Tips
Tip #1: Know the School Districts Properties in Okemos, East Lansing, and Haslett schools command 10–20% premiums over similar properties in Lansing or Holt schools.
Tip #2: MSU Timing Matters Student properties should be listed February–April for August move-ins. Listing in July means competing with hundreds of other landlords.
Tip #3: Section 8 FMR Limits Check HUD Fair Market Rent limits for Ingham County annually. Pricing above FMR eliminates voucher holders from your tenant pool.
Tip #4: Downtown Lansing is Growing Demand for downtown/Old Town rentals has increased 15–20% in past 3 years. Young professionals want walkability. Price accordingly.
Tip #5: Winter Weather Matters Properties without garage or covered parking rent for 5–10% less in Lansing. Snow and ice are real concerns for tenants.
The Bottom Line
Pricing your Lansing rental property for maximum ROI isn’t about guessing or hoping. It’s a systematic process:
- Research comps (20–30 similar properties)
- Adjust for features (premium and negative factors)
- Reality-check absorption rate (how fast are properties renting at different price points?)
- Factor in seasonality (May–August peak, November–February slow)
- Know your target tenant (students, professionals, families have different priorities)
- Test and adjust quickly (reduce by Week 3 if no applications)
- Build in annual increases (3–5% to keep pace with market and costs)
The property owners who maximize ROI aren’t the ones who charge the highest rent. They’re the ones who find the optimal balance between rent price, vacancy time, and tenant quality.
Price too high, and you lose thousands in vacancy. Price too low, and you leave thousands on the table every year. Price at market with data-driven adjustments, and you maximize revenue while minimizing turnover.
Every $100/month in optimal pricing = $1,200/year = $6,000 over 5 years.
Get your pricing right, and the ROI takes care of itself. Pricing your rental property correctly is one of the most important decisions you’ll make. If you’re unsure what your Lansing-area property should rent for, we offer free 20minute consultations that include a detailed rent analysis and market comparison. Our cost is your cost—transparent guidance backed by 19 years of local market data.
Recent Comments